2  Pandas (17-Oct-2023)

2.1 Creating a Dataframe

import numpy as np
import pandas as pd

df = pd.DataFrame(np.random.rand(500, 5), columns=["A", "B", "C", "D", "E"])
df
            A         B         C         D         E
0    0.856252  0.102049  0.295876  0.789582  0.843429
1    0.400901  0.610310  0.148885  0.124208  0.609243
2    0.324309  0.981700  0.898121  0.020769  0.214986
3    0.534536  0.021248  0.145527  0.277919  0.820667
4    0.746529  0.607802  0.005638  0.968393  0.262648
..        ...       ...       ...       ...       ...
495  0.223440  0.682736  0.099580  0.241913  0.437043
496  0.838493  0.442379  0.488953  0.881685  0.574390
497  0.073937  0.298118  0.223835  0.761533  0.876930
498  0.452711  0.016009  0.886962  0.018031  0.073792
499  0.933603  0.775989  0.772776  0.925191  0.351461

[500 rows x 5 columns]
2.2 Describe a Dataframe

df.describe()
                A           B           C           D           E
count  500.000000  500.000000  500.000000  500.000000  500.000000
mean     0.510241    0.490173    0.503767    0.508336    0.505923
std      0.284866    0.291609    0.291023    0.283536    0.288912
min      0.000322    0.000689    0.002028    0.001249    0.000536
25%      0.267188    0.246012    0.237135    0.271044    0.235868
50%      0.506319    0.490152    0.500333    0.524407    0.525994
75%      0.753687    0.732322    0.754993    0.744767    0.752291
max      0.998314    0.999588    0.994468    0.997145    0.999849
df.head(5)
          A         B         C         D         E
0  0.856252  0.102049  0.295876  0.789582  0.843429
1  0.400901  0.610310  0.148885  0.124208  0.609243
2  0.324309  0.981700  0.898121  0.020769  0.214986
3  0.534536  0.021248  0.145527  0.277919  0.820667
4  0.746529  0.607802  0.005638  0.968393  0.262648
df.tail(5)
            A         B         C         D         E
495  0.223440  0.682736  0.099580  0.241913  0.437043
496  0.838493  0.442379  0.488953  0.881685  0.574390
497  0.073937  0.298118  0.223835  0.761533  0.876930
498  0.452711  0.016009  0.886962  0.018031  0.073792
499  0.933603  0.775989  0.772776  0.925191  0.351461
# counting unique values
df['A'].nunique()
500
# display the columns in the data frame
df.columns
Index(['A', 'B', 'C', 'D', 'E'], dtype='object')
# information about dataframe
df.info()
<class 'pandas.core.frame.DataFrame'>
RangeIndex: 500 entries, 0 to 499
Data columns (total 5 columns):
 #   Column  Non-Null Count  Dtype  
---  ------  --------------  -----  
 0   A       500 non-null    float64
 1   B       500 non-null    float64
 2   C       500 non-null    float64
 3   D       500 non-null    float64
 4   E       500 non-null    float64
dtypes: float64(5)
memory usage: 19.7 KB

2.3 Load Files

2.3.1 CSV Files

df = pd.read_csv("datasets/world-report-2018.csv", sep=",")
df
     Overall rank  ... Perceptions of corruption
0               1  ...                     0.393
1               2  ...                     0.340
2               3  ...                     0.408
3               4  ...                     0.138
4               5  ...                     0.357
..            ...  ...                       ...
151           152  ...                     0.064
152           153  ...                     0.097
153           154  ...                     0.106
154           155  ...                     0.038
155           156  ...                     0.076

[156 rows x 9 columns]

2.3.1.1 Using Indexes

df = pd.read_csv("datasets/world-report-2018.csv", sep=",", index_col = ["Overall rank"])
df
                     Country or region  ...  Perceptions of corruption
Overall rank                            ...                           
1                              Finland  ...                      0.393
2                               Norway  ...                      0.340
3                              Denmark  ...                      0.408
4                              Iceland  ...                      0.138
5                          Switzerland  ...                      0.357
...                                ...  ...                        ...
152                              Yemen  ...                      0.064
153                           Tanzania  ...                      0.097
154                        South Sudan  ...                      0.106
155           Central African Republic  ...                      0.038
156                            Burundi  ...                      0.076

[156 rows x 8 columns]

2.3.2 Excel Files

df = pd.read_excel("datasets/hr.xlsx", engine="openpyxl") #You have to install library openpyxl
df
         Emp_Id  satisfaction_level  ...  Department  salary
0      IND02438                0.38  ...       sales     low
1      IND28133                0.80  ...       sales  medium
2      IND07164                0.11  ...       sales  medium
3      IND30478                0.72  ...       sales     low
4      IND24003                0.37  ...       sales     low
...         ...                 ...  ...         ...     ...
14994  IND40221                0.40  ...     support     low
14995  IND24196                0.37  ...     support     low
14996  IND33544                0.37  ...     support     low
14997  IND40533                0.11  ...     support     low
14998  IND11649                0.37  ...     support     low

[14999 rows x 11 columns]
df = pd.read_excel("datasets/e-commerce.xlsx", engine="openpyxl") #You have to install library openpyxl
df
                             Email  ... Yearly Amount Spent
0        mstephenson@fernandez.com  ...          587.951054
1                hduke@hotmail.com  ...          392.204933
2                 pallen@yahoo.com  ...          487.547505
3          riverarebecca@gmail.com  ...          581.852344
4    mstephens@davidson-herman.com  ...          599.406092
..                             ...  ...                 ...
495   lewisjessica@craig-evans.com  ...          573.847438
496            katrina56@gmail.com  ...          529.049004
497             dale88@hotmail.com  ...          551.620145
498            cwilson@hotmail.com  ...          456.469510
499      hannahwilson@davidson.com  ...          497.778642

[500 rows x 8 columns]
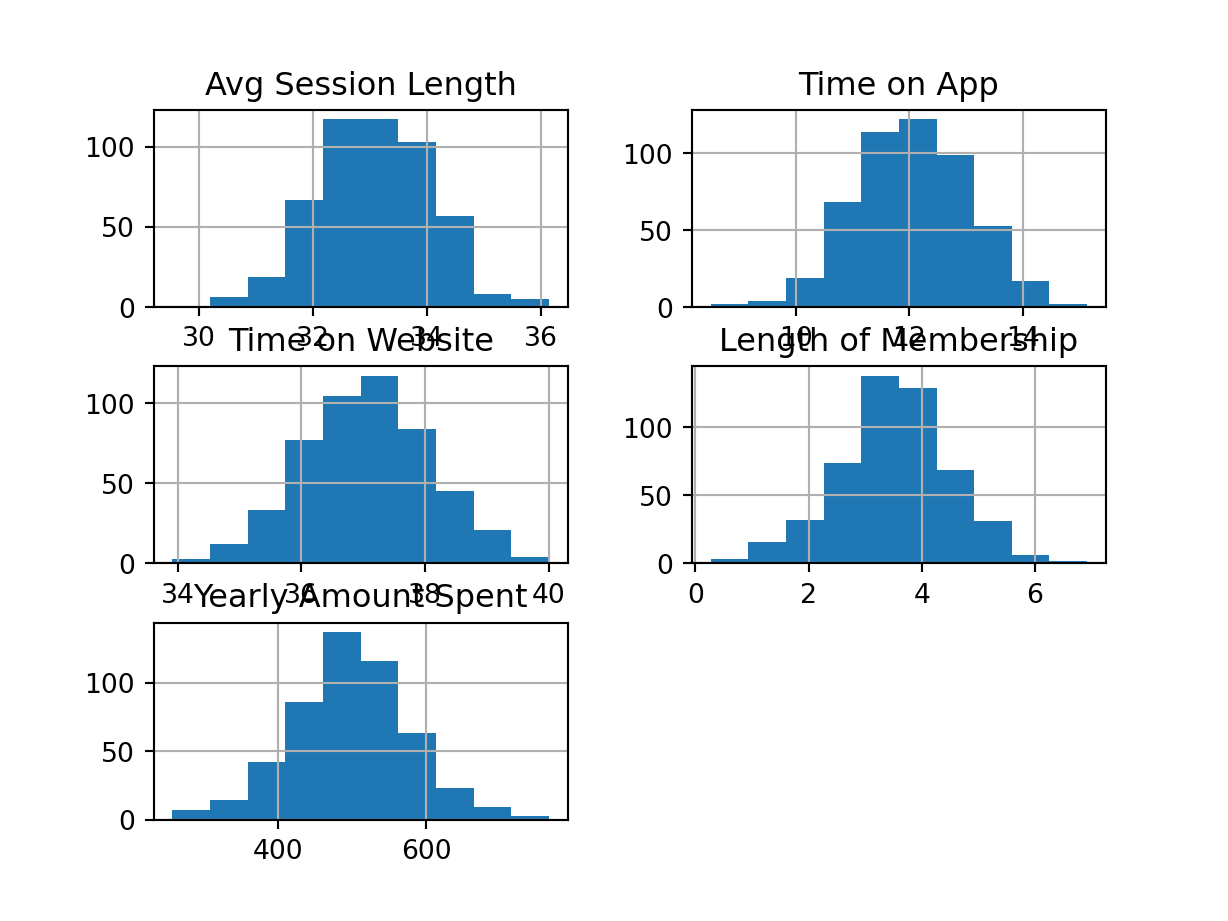
import matplotlib.pyplot as plt 
df.hist() #df.hist(figsize=[12, 8], bins=50)
array([[<Axes: title={'center': 'Avg Session Length'}>,
        <Axes: title={'center': 'Time on App'}>],
       [<Axes: title={'center': 'Time on Website'}>,
        <Axes: title={'center': 'Length of Membership'}>],
       [<Axes: title={'center': 'Yearly Amount Spent'}>, <Axes: >]],
      dtype=object)
plt.show()

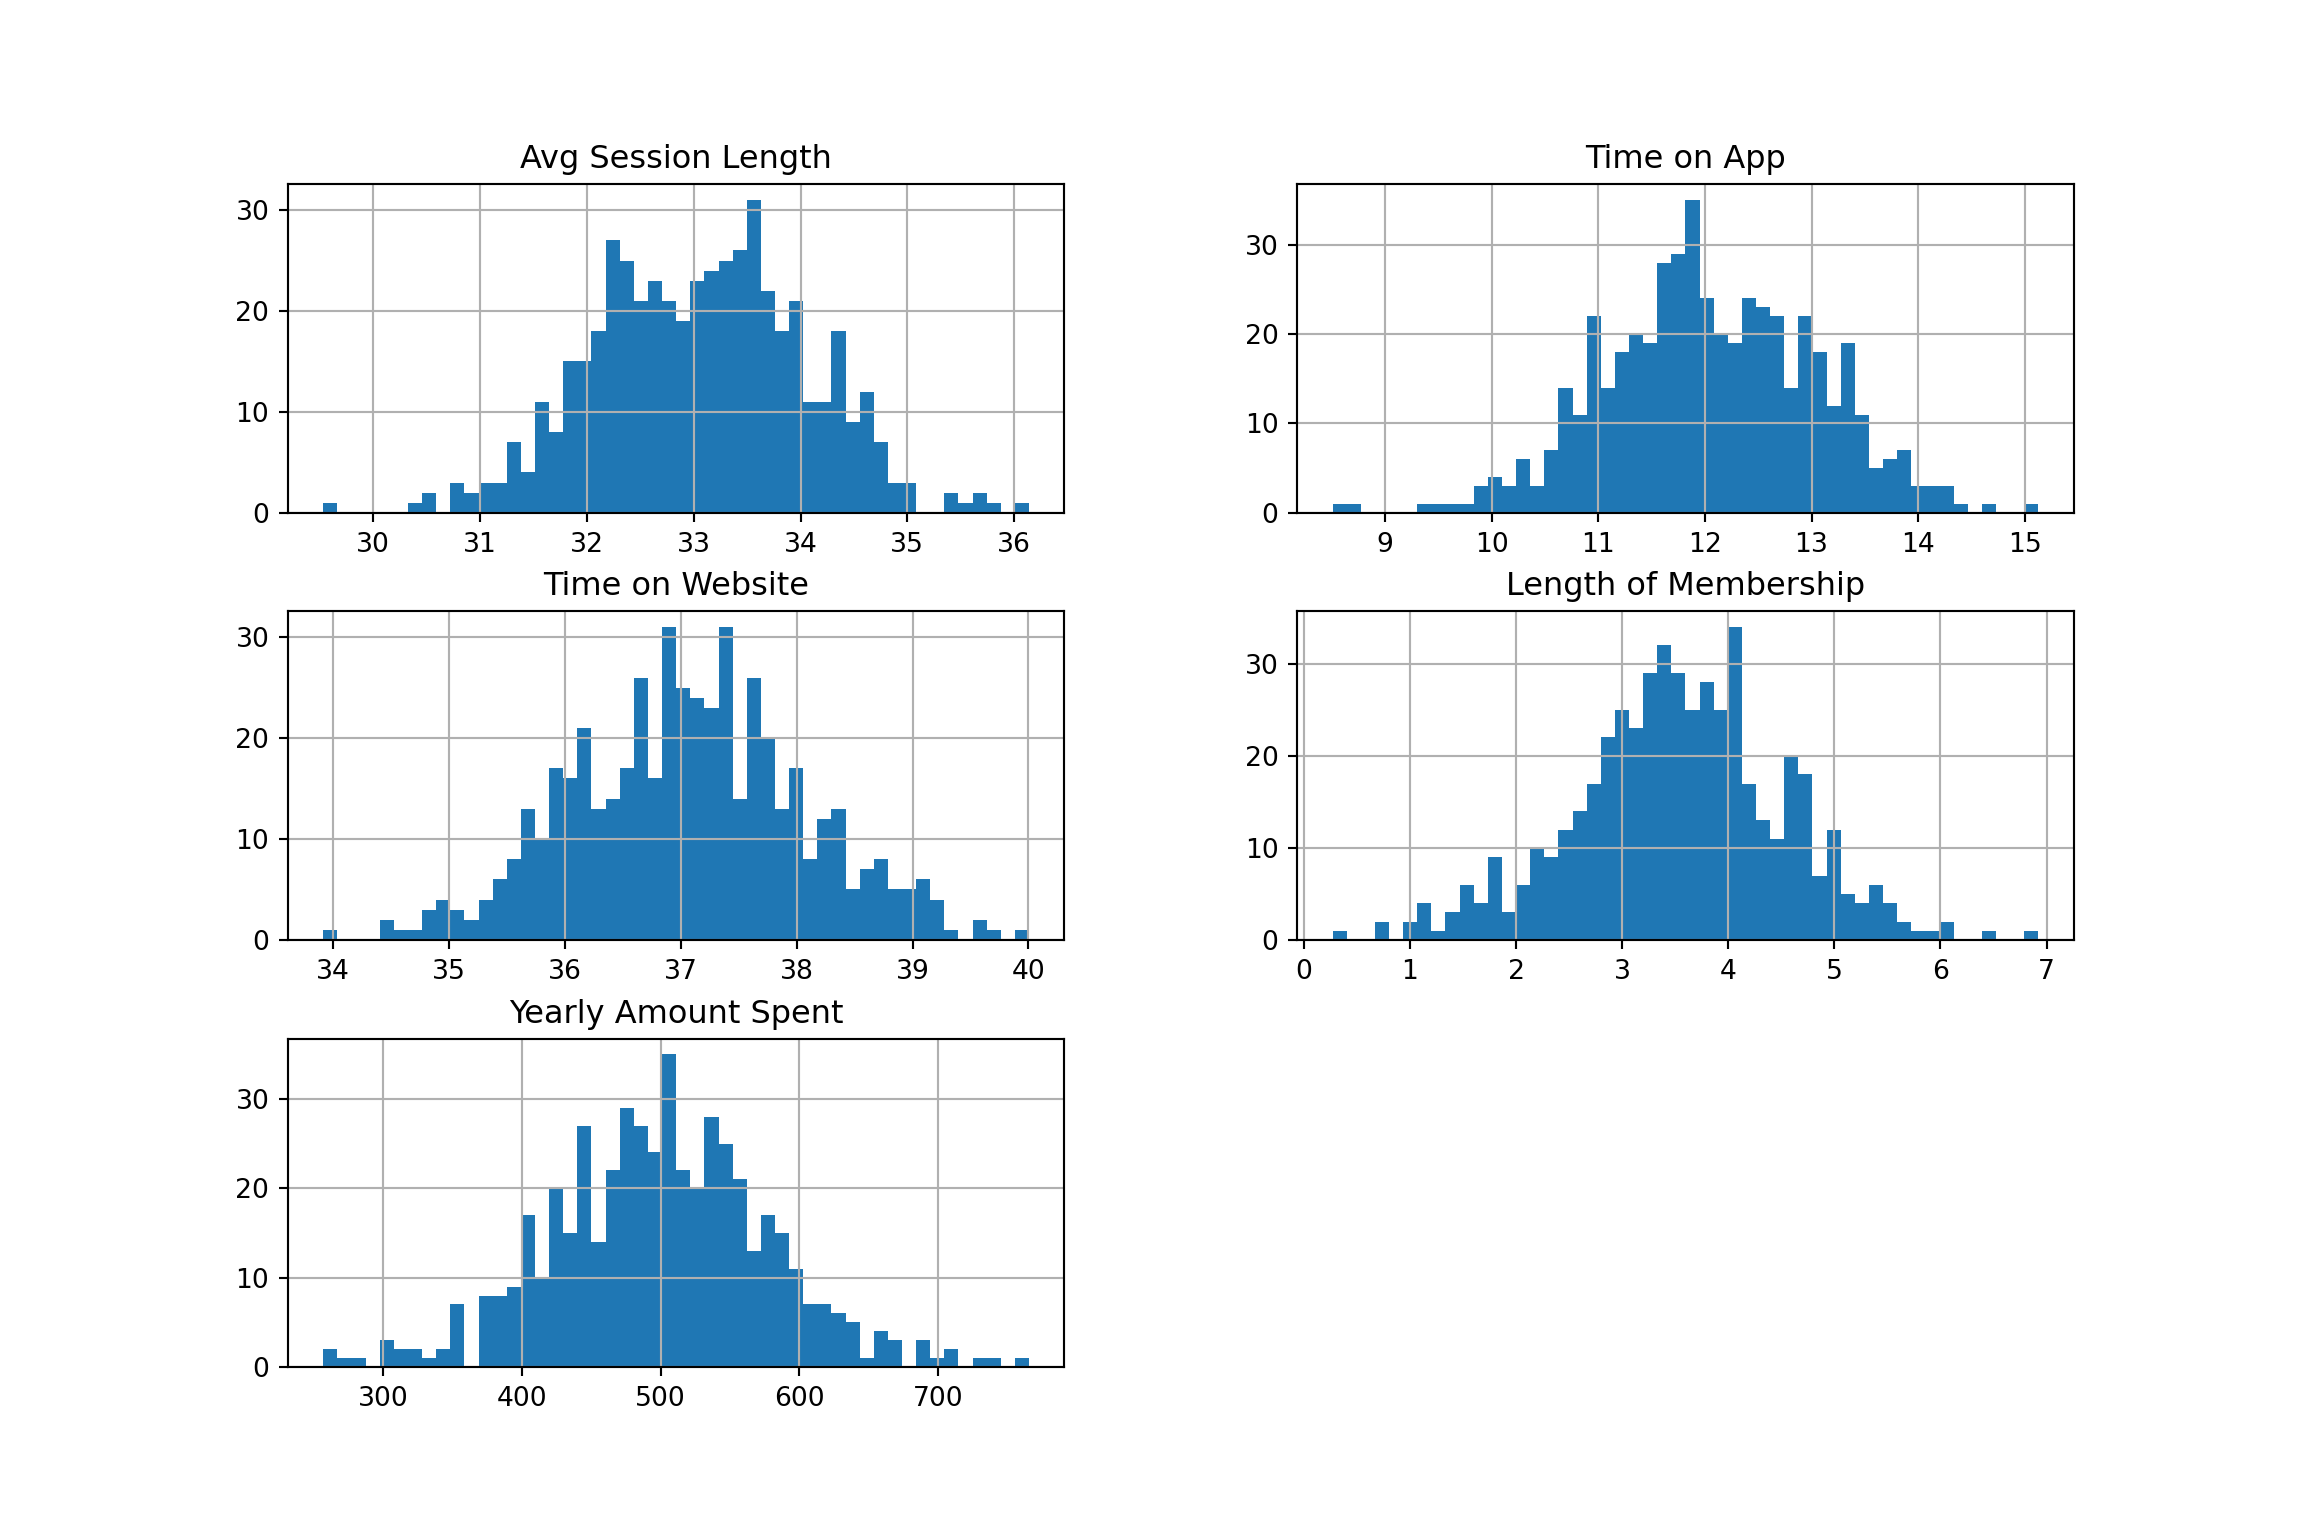
import matplotlib.pyplot as plt 
df.hist(figsize=[12, 8], bins=50)
array([[<Axes: title={'center': 'Avg Session Length'}>,
        <Axes: title={'center': 'Time on App'}>],
       [<Axes: title={'center': 'Time on Website'}>,
        <Axes: title={'center': 'Length of Membership'}>],
       [<Axes: title={'center': 'Yearly Amount Spent'}>, <Axes: >]],
      dtype=object)
plt.show()