3  Describe Data (17-Oct-2023)

3.1 Creating a Dataframe

import numpy as np
import pandas as pd

df = pd.DataFrame(np.random.rand(500, 5), columns=["A", "B", "C", "D", "E"])
df
            A         B         C         D         E
0    0.625566  0.136181  0.258132  0.848060  0.671005
1    0.186940  0.115265  0.262359  0.296583  0.324028
2    0.529420  0.164832  0.514970  0.089745  0.306735
3    0.836814  0.096101  0.585489  0.439697  0.184188
4    0.099389  0.401448  0.730619  0.569632  0.693241
..        ...       ...       ...       ...       ...
495  0.973040  0.599695  0.527298  0.127738  0.945196
496  0.659851  0.133772  0.337827  0.267653  0.529958
497  0.065845  0.730938  0.080159  0.358480  0.463459
498  0.647902  0.135046  0.681809  0.150953  0.742966
499  0.810402  0.594951  0.681952  0.329137  0.692848

[500 rows x 5 columns]
3.2 Describe a Dataframe

df.describe()
                A           B           C           D           E
count  500.000000  500.000000  500.000000  500.000000  500.000000
mean     0.496357    0.478355    0.530049    0.495923    0.509280
std      0.306415    0.289352    0.280110    0.300637    0.288741
min      0.000612    0.001273    0.003276    0.000596    0.004323
25%      0.220480    0.210976    0.294837    0.228541    0.276918
50%      0.486487    0.471756    0.542893    0.485196    0.511271
75%      0.777159    0.719584    0.769016    0.764413    0.746484
max      0.999676    0.998137    0.996840    0.998894    0.999593
df.head(5)
          A         B         C         D         E
0  0.625566  0.136181  0.258132  0.848060  0.671005
1  0.186940  0.115265  0.262359  0.296583  0.324028
2  0.529420  0.164832  0.514970  0.089745  0.306735
3  0.836814  0.096101  0.585489  0.439697  0.184188
4  0.099389  0.401448  0.730619  0.569632  0.693241
df.tail(5)
            A         B         C         D         E
495  0.973040  0.599695  0.527298  0.127738  0.945196
496  0.659851  0.133772  0.337827  0.267653  0.529958
497  0.065845  0.730938  0.080159  0.358480  0.463459
498  0.647902  0.135046  0.681809  0.150953  0.742966
499  0.810402  0.594951  0.681952  0.329137  0.692848
# counting unique values
df['A'].nunique()
500
# display the columns in the data frame
df.columns
Index(['A', 'B', 'C', 'D', 'E'], dtype='object')
# information about dataframe
df.info()
<class 'pandas.core.frame.DataFrame'>
RangeIndex: 500 entries, 0 to 499
Data columns (total 5 columns):
 #   Column  Non-Null Count  Dtype  
---  ------  --------------  -----  
 0   A       500 non-null    float64
 1   B       500 non-null    float64
 2   C       500 non-null    float64
 3   D       500 non-null    float64
 4   E       500 non-null    float64
dtypes: float64(5)
memory usage: 19.7 KB

3.3 Histograms

import matplotlib.pyplot as plt 
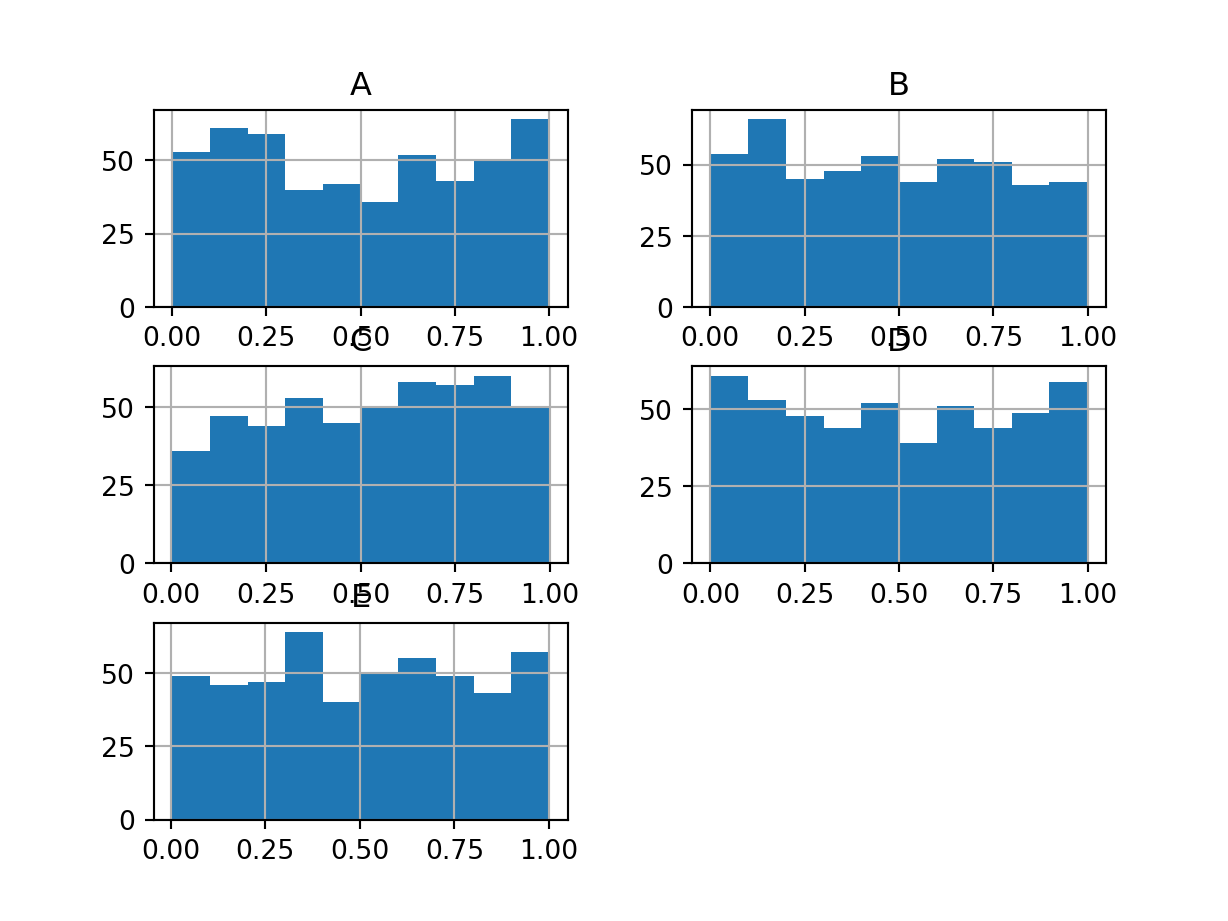
df.hist() #df.hist(figsize=[12, 8], bins=50)
array([[<Axes: title={'center': 'A'}>, <Axes: title={'center': 'B'}>],
       [<Axes: title={'center': 'C'}>, <Axes: title={'center': 'D'}>],
       [<Axes: title={'center': 'E'}>, <Axes: >]], dtype=object)
plt.show()

3.4 Package ydata-profile

from ydata_profiling import ProfileReport

profile = ProfileReport(df, title="Profiling Report")

profile.to_file("./profiling.html")